Dashboard
Virgo contains valuable information about your organization's records and information governance programs. The sections on the Dashboard tab summarize your data and provide quick access to the details.
You can customize your dashboard. You can specify the sections that display and the layout. Then, when you log into Virgo, you can see the information that matters most to you. You can also subscribe to Virgo email notifications that inform you of citation changes and new comments.
The dashboard sections answer questions like:
- How has the regulatory landscape changed over time and where do you currently have citation coverage?
- What have people been saying in the comments across the retention schedule?
- How is your privacy classification project coming along?
 This Help topic includes the following sections:
The table below describes the Dashboard components.
| Sections | Description |
|---|---|
|
An overview of changes to defining, mapped, and unmapped citations. Hover over a bar chart to view the amount of new citation changes. Click inside the bar for more information. You can customize the Citation Changes section. Click For example, you can specify the date range of citation changes. And you can specify the types of citations that display like changes to citations related to retention. To view the changes in the Citations tab grid, hover your cursor over a bar chart, view the amount of new citation changes, and then click the link. |
|
|
A reverse-chronological list of comments for Record Series. For more information, click inside the comment. You can customize the Comments section. Click For example, you can filter the comments by date. Also, if you would like to receive an email notification with new comments, you can optionally subscribe to comment notification emails on a daily, weekly, or monthly cadence by enabling this notification under the My Account tab. |
|
|
Citation Jurisdictions |
Displays the jurisdictions that Virgo is tracking for your organization. For example, the jurisdiction could be United States. To view the citations for a jurisdiction on the Citations tab grid, hover your cursor over a country, and then click the jurisdiction link. |
|
Content Type by Privacy |
An overview of your organization's content types. For example, the number and percentage of content types that are not yet categorized. You can filter the graph by clicking the privacy types to the right of the graph. To view the content types by privacy type on the Content Types tab grid, hover your cursor over an area of the graph, and then click the privacy type link. |
|
Record Series Status |
An overview of your organization's record series statuses. For example, the number and percentage of record series that are not yet published. You can filter the graph by clicking the privacy types to the right of the graph. To view the record series by status on the Record Series tab grid, hover your cursor over an area of the graph, and then click the status link. |
|
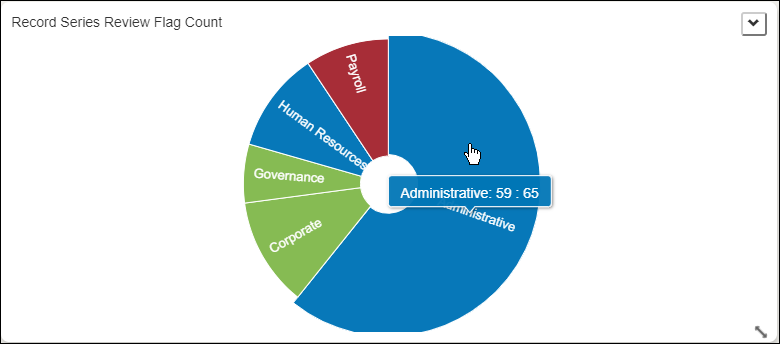
If the Record Series Review Flag Count widget is enabled, section displays the number of flagged mappings for record series that need to be reviewed. Each wedge represent functions, for example Human Resources and Administrative. And each wedge displays a count of the record series for that function and a count of flagged mappings for those record series.
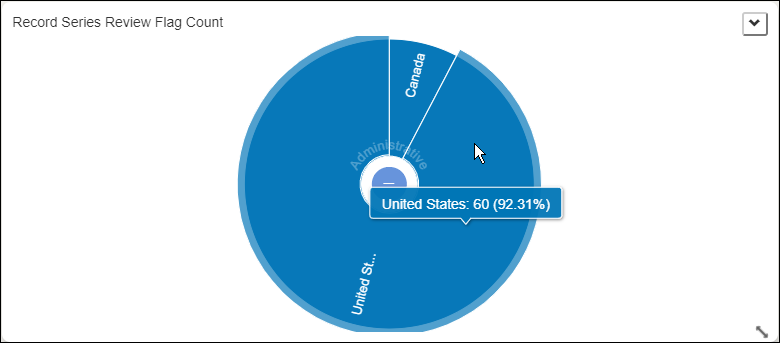
TIP: The same information can display on the Record Series tab. For more details on the flagged mappings count, in the chart, you can click a wedge which represents a record series function (for example, Administrative) and the jurisdiction will display (for example, United States).
You can also click the jurisdiction link to display the related record series on the Record Series tab. You can click |
Virgo lets you customize and save your dashboard layout and settings, so each time you log into Virgo you see the data that matters most.
-
Click the Dashboard tab.
-
On the bottom right corner of the Dashboard tab, click
 .
. -
Select the check boxes next to the sections to display on your Dashboard. Clear the check boxes next to the sections to not display on your Dashboard.
-
Click Update.
-
Drag to move a section.
-
Drag the lower-right corner to re-size a section.
-
On the bottom left of the Dashboard, click Save to preserve your customized dashboard.
Virgo lets you customize and save the section settings, so each time you log into Virgo you see specific functions and the jurisdictions.
-
Click the Dashboard tab.
-
On the bottom right corner of the Dashboard tab, click
. -
On the Record Series Review Flag Count section, click
 .
. -
On the Function tab, select the functions to display, for example Administrative and Human Resources. By default, all your organization's functions are selected. If you manually select no functions the Record Series Review Flag Count chart will not display. So select at least one function.
-
By default, when you select functions to display, the corresponding jurisdictions also display. But on the Jurisdiction tab, you can also refine the jurisdictions to display, for example Canada and United States.
-
You can also Select All jurisdictions or Select None. If you Select None or manually select no jurisdictions, the functions on the Functions tab are unselected, and the Record Series Review Flag Count chart will not display. Also, if you deselect a jurisdiction linked to a function, the function will not display. So select at least one jurisdiction. Then, the corresponding functions on the Functions tab will also be selected and display.
-
You can also select Blank to display the global jurisdiction (applied everywhere). Select Not Blank to display all jurisdictions except global.
-
On the bottom left of the Dashboard, click Save to preserve your customized dashboard.
On the Dashboard tab you can now subscribe to Virgo email notifications that inform you of citation changes and new comments.

-
Click the Dashboard tab.
-
On the bottom right corner of the Dashboard tab, click
. -
To display the Citation Changes section on the Dashboard tab, leave the Citation Changes check box selected. You can subscribe to citation updates email notifications with the same information as Citation Changes widget on the Dashboard. The email notifications are sent from virgo-service@accesscorp.com. Select Monthly or Quarterly, and then click Save.
-
To display the Comments section on the Dashboard tab, leave the Comments check box selected. You can subscribe to comment updates email notifications with the same information as Comments widget on the Dashboard. The email notifications are sent from virgo-service@accesscorp.com. If there are no comments, Virgo sends no email. Select Daily, Weekly, or Monthly, and then click Save.
-
Click Update.